18 September, 2024

Future Shock: the Coming Wave of Office ObsolescenceWhat is the Market Evidence?

Share:

VIEW THE FULL REPORT

These problems are already evident in office market metrics. Offices typically accounted for 40-50% of UK investment volumes between 2001 and 2015/16. This figure has been in consistent decline for almost a decade now and has recently been closer to 25-30%. The increasing attractiveness of sectors such as residential and industrial may also be factors against the backdrop of tight pricing.

However, more recently, it is likely to be related to Global concerns over the future of offices driven Primarily by the us experience. And while the UK’s office market appears stronger than in many other geographies, investor demand has fallen back. Between 2001 and around 2015/16, offices almost Always accounted for 40-50% of UK investment Volumes. This figure has been in consistent decline For the past few years and has recently been closer To 25-30%.

Leasing has not been as badly hit as investment, with volumes across the whole of the UK 36% below the 10-year average as of the year to Q2 2024. But what is perhaps more telling is how different markets have performed. The City Core was only 5% below the long-term average, while Outer London was 37% below. And while the major city cores outside London have seen a 38% fall, their hinterlands are some 50% below long-term trends.

In short, the figures do indeed, as predicted, point towards a lower aggregate demand for offices, but with some locations seeing robust or even stronger activity than before the pandemic. This is particularly the case in Central London. Equally, while the big cities outside London have seemed weaker recently, the gap between their cores and their out-of-town markets appears to have increased. The real challenge, though, is how second-tier cities and towns cope with this new phase of economic urbanisation.

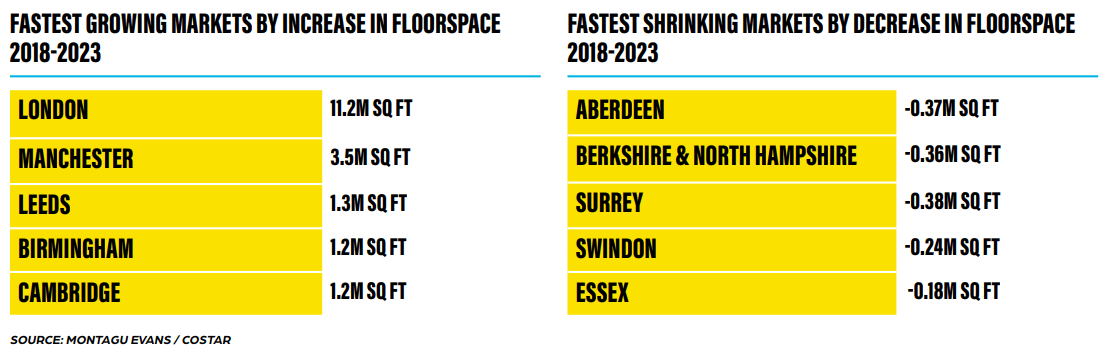
The stock itself has already begun to respond to these trends. As can be seen below, the fastest growing markets over the past five years are London and the other big cities, as well as Cambridge. Meanwhile, the markets which have seen the most significant contraction are largely the out-of-town markets around London, in the Home Counties, except for Aberdeen, which has particular issues given its heavy dependence on the oil & gas markets.

This geographic polarisation is increasingly apparent in market statistics. The highest vacancy rates – at 20% or more – are generally in town or out-of-town locations such as Swindon, Maidenhead and Woking as well as non-central London office markets such as Hammersmith, Docklands and Chiswick. City centres such as Manchester, Birmingham and Bristol also have relatively high vacancy rates – just behind these areas – but this probably reflects where development has occurred over the past few years; it has been strongly skewed to these locations.

Vacancy rates can be misleading, especially if a lot of space is under construction, but in parts of the Thames Valley around 6% of buildings (weighted by size) have been completely vacant for more than a year, whereas Oxford, Cambridge and Milton Keynes generally have virtually zero in this category. This is likely a combination of demand and difficulties related to planning and infrastructure in building here – meaning the supply response is notably more subdued than in cities such as Manchester or Birmingham.

PRICE SIGNALS

These impacts are also showing up strongly in pricing signals. As the graph of the MSCI Quarterly Property Index below shows, offices have been the worst-performing sector (in terms of total returns) over both the 1- and the 3-year period. Over the past year alone, all office sectors except Central London have seen negative returns of 10% or more, and even in a 5-year period, it is only some retail sectors that perform more poorly.

However, this hides highly differentiated Performance in different parts of the market. Msci Divides its equivalent yields into quartiles; in other words, if the buildings were lined up in order of the Amount of rental growth they have experienced, we Can get an idea of what stands at the quarter-way Point and the three-quarter-way point (as well As in the middle). This provides a good proxy for How the “top” and “bottom” ends of the market are Performing. The results are shown overleaf with the Figures indicating the spread between the upper and lower quartiles (or between “grade a” And “grade b”).

Overall, with 540bps, the spread for offices is over twice as high as the next highest, retail (260bps), indicating quite how polarised current conditions are in this sector. However, looking just at Central London Offices, the spread is much lower, at 190-220bps, more comparable to other sectors. Offices outside the South East show a strong divergence too, at 430bps, but it is the “South East Offices” (the MSCI “Inner South East and East” segment) which has the highest, at 690bps. This, more than anything else, demonstrates how location and quality are combined in this polarisation process.

This gap has intensified strongly over the past few years. The chart below shows how yields moved over the three years to December 2023, using the same quartile analysis as before. For retail and industrial, it is the lowest yielding properties that have seen the biggest shifts, reflecting a “depolarisation”. In contrast, for offices, it is the highest-yielding properties (presumably the poorest quality assets) which have moved the most – 300 basis points overall. This shift is also much higher for South East offices.

Together, this demonstrates that high-quality, well-located offices are still a very attractive investment. Indeed, they may now be underpriced, given the negativity around the sector globally. This is, of course, partly influenced by experiences in the United States, where vacancy rates were historically higher, the office stock somewhat older, and the return to the office, so far at least, rather less marked. On the other hand, it also shows that there are parts of the office market that are in serious trouble in the long term.

PERMITTED DEVELOPMENT RIGHTS

Earlier in the year, the previous government announced changes to PDR rights that removed the vacancy requirements and maximum floor space limit of 1,500 sq m (15,000 sq ft).

This means that many office buildings can be converted to residential use without planning permission. Such PDR rights, where applicable, are subject to prior approval from the local planning authority in which matters such as transport, contamination, flood risk, noise impacts, daylight, and fire safety are material considerations. S106 obligations unrelated to these material considerations cannot be sought and which includes affordable housing – a factor that often makes schemes unviable.

This will doubtlessly speed the conversion of some stock, but there are some constraints. Firstly, many areas with significant office stock – much of Central London and the cores of the most significant cities outside the capital – are covered by Article 4 exceptions, which prevent PDR. Secondly, conversions still have to pass building regulations, and many may not be easily made suitable for residential use. Thirdly, the new government may change this regulation, so there may only be a narrow window. Nevertheless, it is a route for owners to consider, but it may need to be done fairly quickly.

Share: